
5 KPIs Every Practice Owner Should Track

Running a medical practice without monitoring core performance indicators is like flying an airplane without an altimeter or fuel gauge. You might feel like you are cruising along smoothly because your waiting room is full and your staff is constantly on the move, but beneath the surface, silent operational leaks could be draining your profitability. In healthcare management, activity does not automatically equal income.
When practice owners focus solely on top-line revenue or daily appointment counts, they miss the underlying mechanics of revenue cycle management and workflow performance. High gross billing numbers mean very little if a significant portion of those claims is rejected on submission, sits in payer queues for months, or gets written off due to missed filing deadlines. Tracking Five KPIs Every Practice Owner Should Track gives practice administrators and physician owners clear visibility into their operations, turning raw billing data into actionable business intelligence.
Why Five KPIs Every Practice Owner Should Track Form the Foundation of Practice Health
To build a resilient clinical practice, owners need a balanced operational scorecard that captures both leading and lagging indicators. Lagging indicators, such as quarterly net profit, tell you what has already happened, but leading indicators, such as front-office registration accuracy and clean claim submission rates, forecast where your cash flow is headed next month.
By prioritizing the top 5 KPIs Every Medical Practice Should Track, practice leaders can establish an early-warning system. Monitoring these core metrics helps you:
- Eliminate Revenue Leaks: Identify underpaid claims, uncollected patient balances, and contractual billing errors before they turn into write-offs.
- Reduce Administrative Rework: Cut down on the labor-intensive cycle of appealing, re-coding, and resubmitting denied claims.
- Optimize Practice Capacity: Maximize room and provider utilization so that fixed operating overhead translates directly into recognized revenue.
- Stabilize Monthly Cash Flow: Shorten the reimbursement lifecycle to ensure predictable working capital for operating costs and practice expansion.
Implementing Five KPIs Every Practice Owner Should Track into Weekly Workflows
Data tracking is only effective when it leads to operational change. A complex analytics dashboard that no one reviews is simply decorative. The goal is to embed KPI monitoring directly into the weekly administrative rhythm of your practice.
Establishing clear operational ownership is the first step toward continuous improvement. Every tracked metric needs a single team member responsible for monitoring its trend and managing corrective steps when numbers drift past established thresholds. For example, your front-desk lead should own registration accuracy and eligibility verification, while your billing manager owns Days in A/R and denial resolution. To learn more about creating predictable operational structures, read our guide on How to Build Systems That Let Your Practice Run Without You.
The 5 Crucial Metrics: Benchmarks, Formulas, and Red Flags

To evaluate your practice's financial performance objectively, you need standardized formulas, target industry benchmarks, and clear operational warning signals. Below is a quick-reference summary of the five core performance metrics every practice owner should monitor.
| Metric | Calculation Formula | Target Benchmark | Red Flag Threshold |
|---|---|---|---|
| 1. First-Pass Clean Claim Rate (CCR) | (Clean Claims Accepted on 1st Submission ÷ Total Claims Submitted) × 100 | 95% – 99% | Below 90% |
| 2. Days in Accounts Receivable (A/R) | (Total Accounts Receivable ÷ Total Gross Charges) × Days in Period | 30 – 40 Days | Above 50 Days (Critical >60) |
| 3. Claim Denial Rate by Payer | (Total Denied Claims ÷ Total Claims Submitted) × 100 | Under 5% | Above 10% (Single Payer >12%) |
| 4. Net Collection Rate (NCR) | [Payments Collected ÷ (Total Charges − Contractual Adjustments)] × 100 | 95% – 99% | Below 93% |
| 5. Patient No-Show Rate | (Unfilled Missed Appointments ÷ Total Scheduled Appointments) × 100 | 5% – 7% | Above 15% – 20% |
1. First-Pass Clean Claim Rate (CCR)
First-pass clean claim rate measures the percentage of insurance claims processed and accepted by the payer on initial submission without requiring manual correction, additional documentation, or administrative intervention. It is one of the most reliable measures of front-end billing quality and patient registration accuracy.
How to Calculate First-Pass Clean Claim Rate
To calculate CCR, take the total number of claims accepted on first pass during a given billing cycle, divide it by the total number of claims submitted in that same period, and multiply by 100.
Industry Benchmark and Targets
The baseline industry average clean claim rate hovers around 95%. Top-performing practices utilizing purpose-built billing technology with integrated scrubber engines consistently achieve 97% to 99%.
What a Low or Declining Clean Claim Rate Indicates
When your clean claim rate dips below 90%, it points to upstream administrative bottlenecks. Common root causes include incorrect patient demographics recorded at check-in, expired insurance eligibility, missing clinical modifiers, or outdated ICD-10/CPT coding updates.
Industry data shows that re-working and re-submitting a single denied or rejected claim costs upwards of $25 to $30 in administrative labor. A practice submitting 1,000 claims per month with a 90% clean claim rate creates 100 manual re-works every cycle—costing $2,500 in wasted administrative overhead per month. To maintain high accuracy on initial claim submission, review our detailed guide on 5 KPIs Every Practice Administrator Should Be Tracking.
2. Days in Accounts Receivable (A/R)
Days in Accounts Receivable measures the average number of days it takes for a practice to convert billed services into realized cash reimbursement from payers and patients. This metric highlights overall billing turnaround time and financial operational efficiency.
How to Calculate Days in A/R
First, determine your average daily charge by dividing total gross charges over a specific timeframe (e.g., 90 or 365 days) by the total number of days in that period. Next, divide your total outstanding accounts receivable balance by that average daily charge figure.
Industry Benchmark and Targets
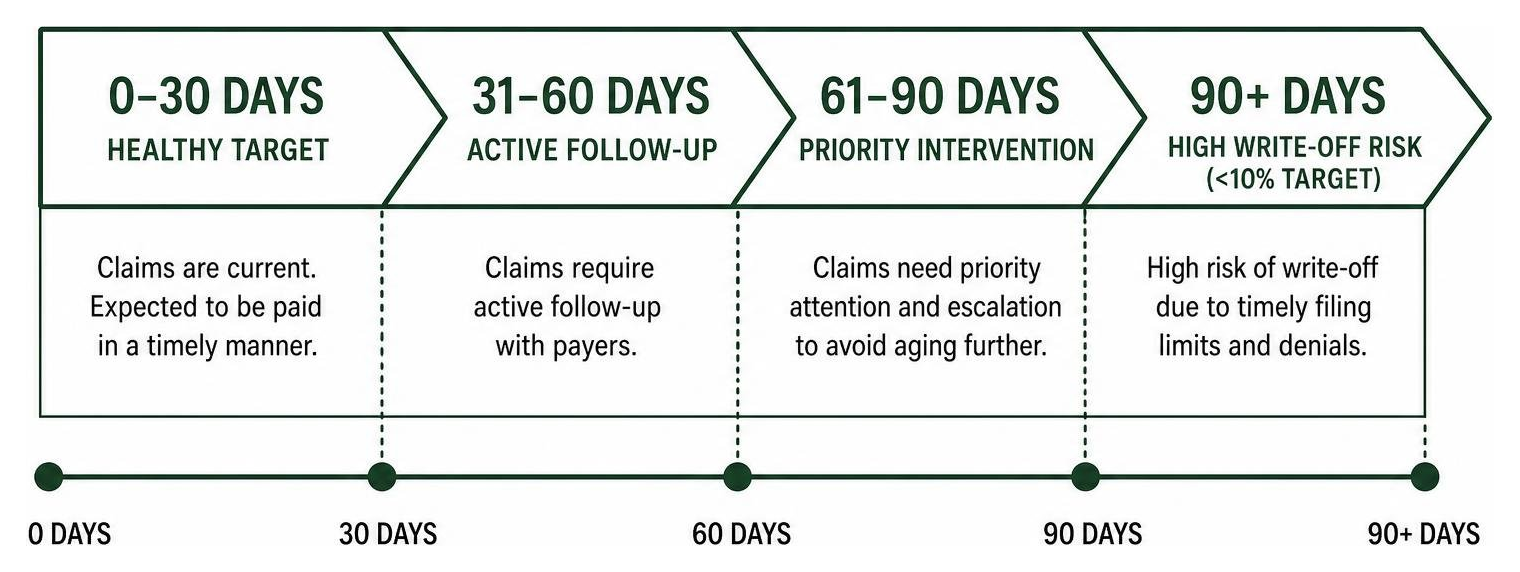
According to MGMA benchmarks, a healthy medical practice maintains Days in A/R between 30 and 40 days. Outstanding claims sitting in the 90+ day aging bucket should account for less than 10% (and ideally under 5%) of your total A/R balance.
Operational Warning Signs of High A/R
When Days in A/R climbs past 50 days, cash flow bottlenecks are forming. A metric exceeding 60 days means unworked denials are piling up, secondary claims are missing attachments, or insurance clearinghouse rejections are going unmonitored. The older an unpaid claim becomes, the harder it is to collect: collectible value drops sharply after 90 days due to payer timely filing limits.
3. Claim Denial Rate by Payer
Claim denial rate tracks the proportion of submitted claims that payers formally refuse to reimburse. While tracking your overall blended denial rate is necessary, segmenting denials down to individual insurance payers reveals specific administrative bottlenecks and policy enforcement shifts.
How to Calculate Claim Denial Rate
Divide the total dollar amount (or total count) of denied claims by the total dollar amount (or total count) of claims submitted during the same timeframe, multiplied by 100.
Industry Benchmark and Targets
National surveys place the average claim denial rate between 6% and 11%. A well-managed private practice should target a blended denial rate under 5%, with high-performing operations holding denials to 2%–3%. In a recent MGMA poll, 60% of medical group leaders reported an increase in claim denial rates, making this metric an essential operational focus for 2026.
Differentiating Initial vs. Final Denial Rates
An initial denial occurs when a claim is rejected on first adjudication but is recoverable upon resubmission or appeal. A final denial represents non-collectible revenue written off completely.
Tracking denial rate by payer helps expose specific trends—such as a 12% denial rate tied to a single insurer requiring strict prior authorization for specialty procedures. High denial rates point directly to gaps in eligibility verification, lack of medical necessity documentation, or shifting payer policies.
4. Net Collection Rate (NCR)
Net Collection Rate (also known as adjusted collection rate) measures the percentage of collectible revenue your practice actually receives after accounting for valid contractual fee adjustments, payer fee schedules, and mandatory write-offs. It provides an accurate picture of financial health by reflecting how effectively you capture every dollar you are legitimately owed.
How to Calculate Net Collection Rate
To calculate NCR accurately, subtract contractual adjustments from total gross charges during a given period to determine your collectible baseline. Then, divide net payments received by that collectible baseline and multiply by 100.
Industry Benchmark and Targets
Industry standards established by practice management consultants require a net collection rate between 95% and 99%. A collection rate below 93% indicates systemic billing issues or uncollected patient financial balances.
Why NCR Outperforms Gross Collection Metrics
Gross collection rate compares raw collections directly against gross billed charges. Because billed charges do not account for insurance discount agreements, gross collection numbers can easily skew performance views.
A declining Net Collection Rate indicates silent margin leaks: underpayments accepted without appeal, uncollected copays and deductibles, or claims written off prematurely by billing staff. For more strategies on optimizing performance metrics across your organization, consult this breakdown of Medical Practice KPIs: 12 Essential Metrics.
5. Patient No-Show and Appointment Utilization Rate
Patient no-show and appointment utilization rates measure how effectively your practice fills provider schedules and utilizes clinical room capacity. Unfilled appointment slots, last-minute cancellations, and missed visits waste valuable clinical time while fixed operating expenses remain constant.
How to Calculate Patient No-Show Rate
Divide the number of unexcused missed appointments by the total number of scheduled patient visits within a given calendar month, then multiply by 100.
Industry Benchmark and Targets
Data shows well-run medical practices average a no-show rate between 5% and 7%. Rates below 5% are considered excellent, whereas no-show rates rising above 15% indicate significant scheduling inefficiencies that damage practice revenue.
The True Cost of Missed Appointments
Missed appointments cost the U.S. healthcare system an estimated $150 billion annually in lost provider capacity. Beyond the immediate loss of visit revenue, high no-show rates drag down provider productivity (wRVUs) and increase schedule lead times, driving frustrated patients to seek care elsewhere.
Implementing automated two-way SMS appointment reminders, setting clear patient attendance policies, and tracking schedule lead times help maintain optimal practice scheduling.
Turning KPI Insights Into Actionable Operational Improvements

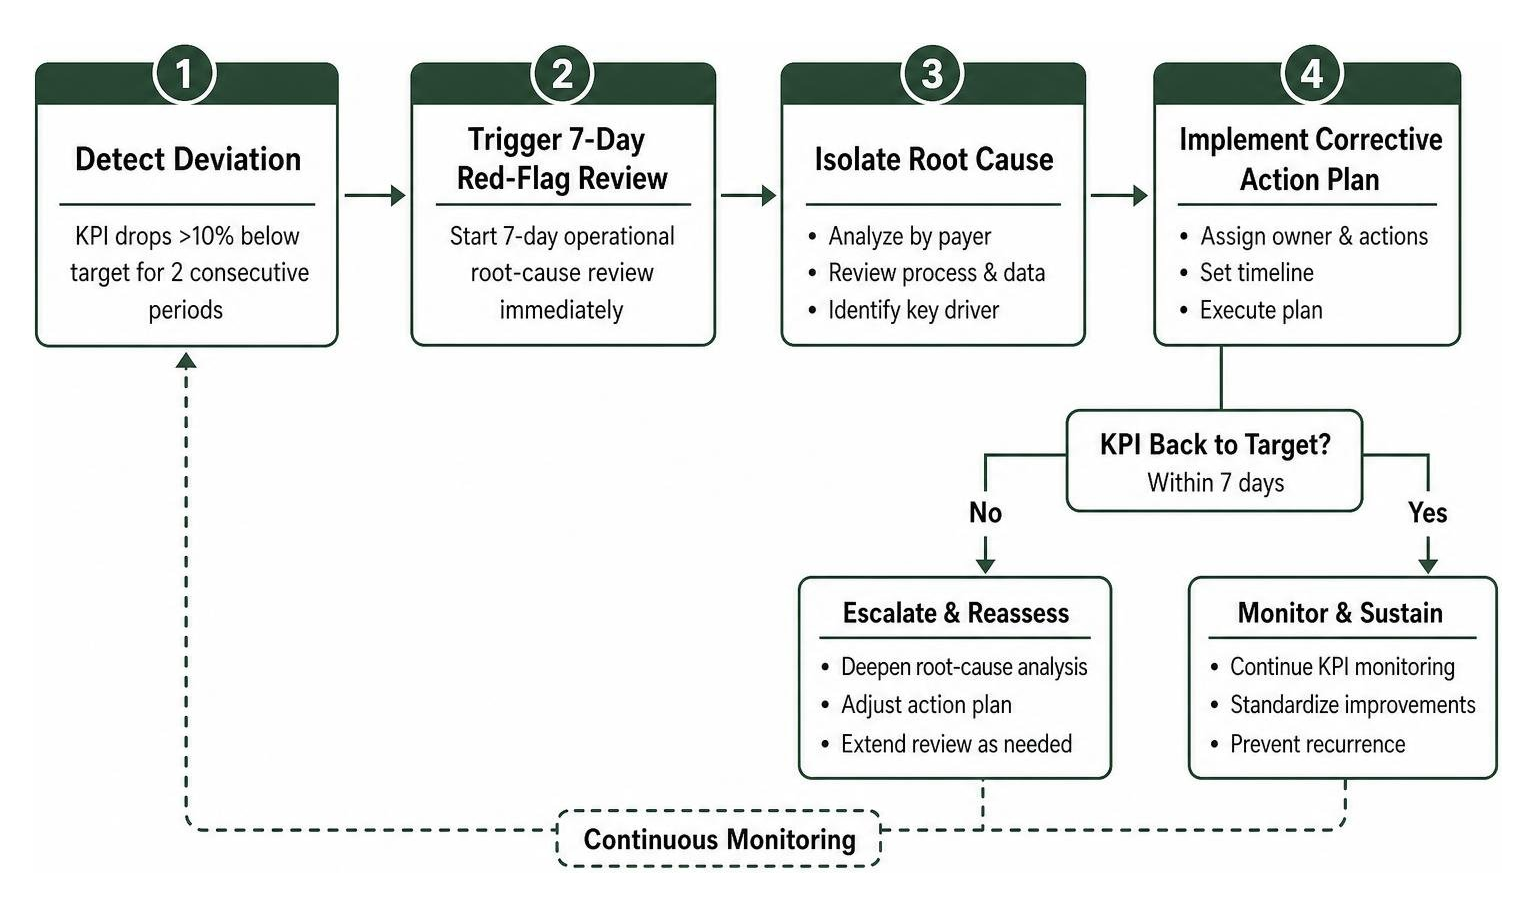
Collecting metric data on a dashboard is useless if it does not lead to concrete action. When performance metrics deviate from target benchmarks, practices need a systematic operational response framework to address root causes.
The 7-Day Operational Red-Flag Protocol
Establish a strict 7-day protocol: if any primary metric drops 10% below its target benchmark for two consecutive reporting periods, initiate an operational root-cause review immediately.
Practical Operational Steps to Correct Declining KPIs
- If Clean Claim Rate drops below 90%: Audit front-desk registration procedures, implement real-time electronic eligibility verification prior to patient check-in, and update coding scrubber rules within your billing software.
- If Days in A/R climbs past 50 days: Segment aging accounts by payer, assign dedicated staff to work claims sitting in the 60+ day aging bucket, and establish automated daily follow-ups for unpaid secondary claims.
- If Denial Rate spikes from a specific payer: Categorize denials by reason code, audit clinical documentation for prior authorization compliance, and schedule formal carrier escalation reviews.
- If Net Collection Rate drops below 93%: Audit fee schedule posting accuracy to identify payer underpayments, mandate point-of-service patient financial collections for copays, and streamline payment processing workflows.
- If Patient No-Show Rate exceeds 10%: Deploy automated multi-channel appointment reminders (SMS, phone, email) 48 hours and 2 hours prior to scheduled visits, establish digital check-in protocols, and maintain a dynamic standby waitlist.
For practical recommendations on maintaining operational efficiency, read our companion post on Simple Ways to Run the Lean Medical Practice.
Frequently Asked Questions About Practice Metrics
How often should practice owners review these five KPIs?
Review cadences should match the operational speed of each metric:
- Weekly: Monitor fast-moving operational indicators like appointment utilization, no-show rates, and initial claim submission queues.
- Monthly: Review financial metrics including First-Pass Clean Claim Rate, Days in A/R, Denial Rate by Payer, and Net Collection Rate alongside monthly financial books.
- Quarterly: Evaluate macro-level trends such as payer contract performance, provider productivity, and overhead ratios to make strategic adjustments.
What is the most critical financial KPI for a private practice?
Net Collection Rate (NCR) is widely considered the single most critical financial KPI. While top-line production and gross charges show clinical volume, NCR proves whether your practice is successfully converting care into actual cash collections. A high production volume paired with a low NCR signals severe administrative revenue leaks.
What does a sudden rise in Days in A/R indicate?
A sudden spike in Days in A/R usually indicates one of three common issues:
- Clearinghouse transmission errors or unsubmitted billing queues resulting from staff turnover or software integration glitches.
- Payer-specific clearinghouse backlogs, delayed claims adjudication, or new documentation requirements.
- A growing stack of unworked claim denials sitting unresolved past 30 days.
Key Takeaways and Summary
To run a sustainable medical practice, practice leaders must look beyond gross revenue totals and track operational efficiency at its root.
- Maintain Front-End Quality: Keep your First-Pass Clean Claim Rate at 95% or higher to minimize administrative re-work costs.
- Accelerate Cash Flow turnaround: Maintain Days in A/R between 30 and 40 days, keeping the share of claims older than 90 days below 10%.
- Audit Payer Denial Patterns: Maintain a blended denial rate below 5% and segment denials by carrier to fix prior authorization and coding errors.
- Protect Collectible Revenue: Target a Net Collection Rate of 95% to 99% to ensure legitimate reimbursements enter your bank account.
- Maximize Practice Capacity: Maintain a no-show rate between 5% and 7% using automated patient reminders to keep provider schedules full.
Conclusion
Tracking operational and financial metrics gives practice owners the visibility needed to control costs, eliminate administrative bottlenecks, and protect profit margins. However, managing billing metrics is only half the financial equation—controlling practice operating costs is equally critical.
Traditional commercial real estate leases subject practice owners to expensive fixed long-term overhead, mandatory square-footage commitments, and significant setup costs. For independent physicians expanding into new markets or establishing private practices in Southern California, adopting a flexible workspace model helps align physical real estate costs directly with patient volume.
At Residen, we provide premium medical coworking spaces in Brentwood, CA and Beverly Hills, CA. Our fully equipped exam, procedure, and consultation rooms are available on flexible hourly, daily, or long-term booking schedules—with no long-term leases or upfront membership fees. By eliminating long-term real estate commitments, practice owners can maintain lean operating structures and maximize profitability.
To learn how flexible workspace solutions can help you Lower Overhead and streamline your operations, Get Started with Residen today to schedule a tour of our locations.